





It is 11:45pm on a Tuesday. The floor is mopped, the chairs are up, the till is counted, and now four people are hunched over an Excel sheet, a pocket calculator, and a notepad of hours in biro, arguing about 0.3 of an hour. Someone is adding the column a second time by hand. The split should have taken less time than turning off the espresso machine.
That scene is what Tipza was built to replace. Not the argument — arguments about fairness are healthy — but the part where the argument is about arithmetic instead of principle.
What Tipza Free actually does
Free is not a demo. It is the full calculator with a roster cap, and for a three-person café or a neighbourhood bistro it may be all you ever need.
Here is what you get at zero cost:
- Four split methods. Equal, hours-weighted, points-based and custom weights. The same four methods that Pro uses, with the same arithmetic.
- Up to three people per split. Enough for a small bar, a coffee counter, or a restaurant with a tight crew.
- Shareable breakdowns. After every split, share the result so everyone sees the hours, the rate, and their share — not just the final number.
- Saved split history. Every split is stored with a date. Tomorrow you can copy last night’s roster instead of rebuilding it.
The typical Tuesday at a three-person coffee bar looks like this: close the register, open Tipza, tap the total, confirm the crew (still there from yesterday), hit equal, share, done. Sixty seconds, and nobody pulled out a napkin.
The inflection point: when Free has done its job
Two things happen that make a team outgrow the free tier, and neither of them is a failure of the tool. They are a success of the team.
The roster crosses three. You have hired a runner, or the kitchen is joining the pool, or Saturday needs eight people and three slots is suddenly not a formatting issue — it is a ceiling. Pro removes it. No limit on team members, no workaround with two separate splits that you mentally reconcile on a bus home.
The questions change. Free answers “who gets what tonight?” — and that is worth answering well. But at some point a manager, an owner, or a curious shift lead starts asking different questions:
- How did this month compare to last month?
- Is the Friday dinner rush actually better than Saturday brunch, or does it just feel that way?
- Are we splitting more per hour this quarter, or are longer shifts just masking a flat pool?
Those questions live in the split history. The data is there. But scrolling through dated entries and doing mental arithmetic across thirty splits is exactly the kind of work Tipza was built to eliminate — just at a different altitude.
What Pro adds: the Insights dashboard
Pro is not a bigger calculator. The split screen is identical. What changes is everything around it — the layer that reads your history and turns it into something you can learn from.
| Feature | Free | Pro |
|---|---|---|
| Split methods (equal, hours, points, custom) | Yes | Yes |
| Shareable breakdowns | Yes | Yes |
| Saved split history | Yes | Yes |
| Team members per split | Up to 3 | Unlimited |
| Tip volume trends | No | Yes |
| Tips-per-hour benchmark | No | Yes |
| Shift-type comparison | No | Yes |
| Team distribution view | No | Yes |
| Priority support | No | Yes |
Both tiers use the same calculation engine. Pro adds the analytics layer and removes the roster cap.
Tip volume trends
Choose a time range — 30 days, 3 months, 12 months — and see the total tips distributed, plotted over time. A line going up is nice. A line going up in the months you changed the rota is a decision you can repeat.
Tips-per-hour benchmark
Total tips divided by total hours, tracked over time. This is the number that strips away shift length and headcount and tells you what an hour of floor time is actually producing. It is also the fairest single metric for comparing a quiet Wednesday to a hectic Friday, because both are normalised to the same unit.
Shift-type comparisons
If you tag splits with a shift type — morning, evening, weekend, event — Pro breaks the numbers down by tag. The question “is brunch actually worth opening for?” stops being a feeling and starts being a chart.
This is also the data that makes scheduling conversations easier. When a team member says Sundays are always slow, you can either agree or show them the graph. Both are better than guessing.
Team distribution view
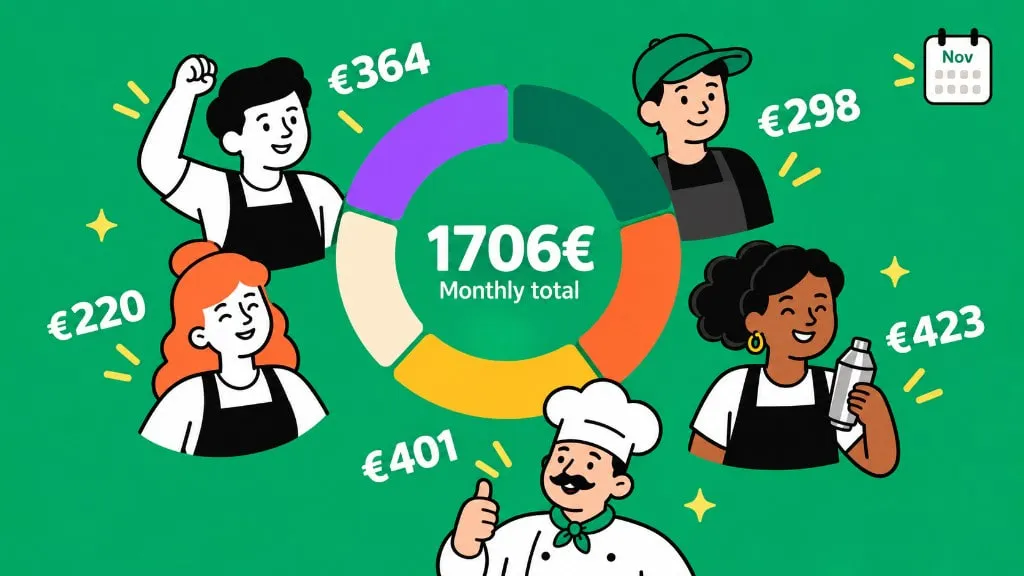
Who received what share over a period, across all splits. Not to rank people — shares follow the method, not individual performance — but to check that the method is producing the distribution the team agreed to. A points system where one role quietly earns twice the hourly rate of another is visible here in a way it never is on a single split screen.
How data makes the team happier
This is the part that sounds like marketing and is actually about conflict prevention.
Most tip disputes are not about greed. They are about information. Someone feels a shift was undervalued because they have no way to check. A manager rotates schedules without knowing which slots the team considers desirable. A new hire suspects the veterans are quietly getting better shifts and has no data to confirm or disprove it.
Transparent analytics fix the information half. They do not resolve genuine disagreements about fairness — that is still the team’s job — but they remove the subset of arguments that exist only because nobody could see the numbers.
-
Schedule with evidence
Shift-type data shows which slots produce the highest and lowest tips per hour. Rotate the good ones and the quiet ones intentionally, instead of repeating last week because nobody checked.
-
Spot a drift before it becomes a grievance
The team distribution view catches a method that is slowly concentrating value in one role. That is fine if deliberate and visible. It is a resignation letter if invisible.
-
Answer the "how are we doing?" question with a chart
Month-over-month trends replace the vague sense that things are better or worse. A chart the team can see is a conversation starter. A number only the manager knows is a rumour.
Start Free, upgrade when the questions change
The honest advice: start with Free. Run splits, build the habit, get the team used to seeing the same numbers. If three people and a clear breakdown is all you need, you have it — permanently and at no cost.
When the roster outgrows three, or when you catch yourself wishing you could see last quarter at a glance, Pro is a tap away inside the app. Your entire split history comes with you. Nothing resets, nothing re-enters. The calculator stays the same; the dashboard appears.